Three Strategies for Reducing Plant Downtime with Data You Collect
Organizations struggling with downtime issues often approach us and tell us they need a way to collect more data to make operational improvements. In these scenarios, most of the time the problem actually is not a lack of data. According to a report from Forrester Research, between 60 and 73 percent of all data within an enterprise goes unused for analytics. Therefore, the real issue most organizations are not aware of is that they have too much data. This overabundance of information makes it difficult to know what data is most valuable for making real improvements.
Solving this data issue is complex because there is not a one-size-fits-all solution for data collection, reporting, and analysis. Not only does every organization have different data needs, but each department, and even each person within those departments, has different key performance indicators (KPIs) that they care about. For example, an operator needs data to keep machines running and production flowing, maintenance staff needs data to properly maintain equipment, and plant schedulers need production and material information to ensure they can execute proper production scheduling and material ordering.
So, that leads us to the key question – how can plant engineers and management get the right data into the hands of the right staff at the right time to ultimately reduce downtime? Let’s look at three strategies to achieve this.
Strategy 1: Sometimes, Less is More
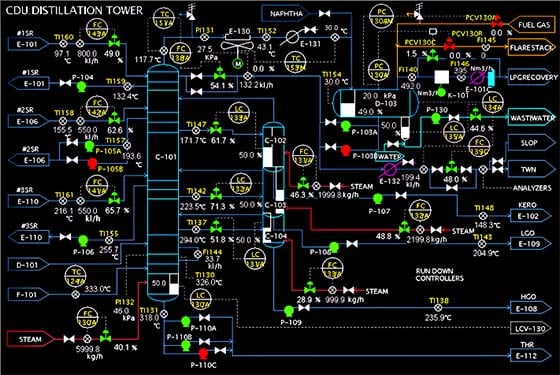
Equipment operators are an organization’s first line of defense against downtime. However, it can be difficult for operators to know when a problem is about to happen because most operator interfaces display an overabundance of information, making it tough for operators to know what data is relevant (Figure 1). With hundreds of indicators and some machines constantly showing an alarm state, how does the operator know if they are seeing relevant information for minimizing downtime?

Figure 1. With so much information on the UI, it can be tough for operators to know the key indicators they should focus on (Source).
When it comes to the operator interface, less can truly be more. Too many companies are tempted to take the hundreds or thousands of I/O points available and display as many as they can. But most operators don’t need to see all, or even the majority, of this information. Instead, it’s best to spend some time analyzing operational data to identify trends that lead to downtime events. By prioritizing communication of data for the key factors that generally lead to downtime instead, it is much more likely operators will successfully mitigate downtime.
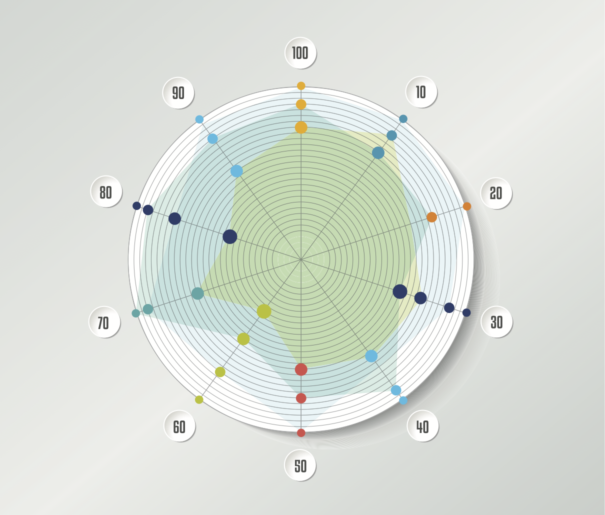
For example, when looking at trend data, you may determine that when the temperature is high and an agitator is running abnormally fast, there is a correlation with low viscosity, which causes production issues downstream and potential downtime. In this instance, if data is displayed on the operator UI related to trends for temperature, motor speed, and viscosity, and a correlation between these data points is shown, operators are more likely to catch this issue before it results in downtime (Figure 2).
 Figure 2. This radar chart graphically displays multivariate data and shows how the different variables relate to each other.
In summary, by simplifying UIs to show less, but more relevant, built-for-a-purpose discrete information, your organization will likely increase uptime.
Strategy 2: Using Data to Enhance Maintenance Practices
To organize and manage maintenance requests, most manufacturers have a computerized maintenance management system (CMMS) in place. While the capabilities of a CMMS can vary widely, oftentimes the basic functionality includes a system where operators can log a request when an event occurs that requires the attention of maintenance personnel. The CMMS then creates a ticket for maintenance to perform the work.
This process seems to work well for most organizations, but what if there was a way to use data to improve a CMMS? It’s rare that an organization would see the CMMS as having room for improvement unless it wasn’t working correctly, but in reality, a few changes to the data communicated to the CMMS can help reduce downtime. For example, all maintenance teams have standard operating procedures (SOPs) for prioritizing equipment maintenance and likely have a periodic routine maintenance schedule in place, not one that is based on actual manufacturing volume or runtime.
Instead of a rudimentary ticketing system like this, we recommend making a shift that allows the CMMS to consider actual utilization and best practices. This can be done by integrating data from an organization’s enterprise resource planning (ERP) and control systems into the CMMS, as well as information on recommended maintenance from equipment manufacturers to keep systems running optimally. This change will certainly extend the life of your equipment and increase uptime by reducing unnecessary maintenance downtime.
Strategy 3: Working with a Resource to Address Cross-Departmental Data Needs
As we established, most manufacturers are collecting plenty of data. The real issue is how to mine this large amount of available data to determine the KPIs for each area of the organization as well as a clear and concise way to communicate that information. This is difficult to do because most organizations do not have a dedicated resource tasked with understanding the data needs of each department and how to optimize existing data to meet those needs. It’s also rare that a single person is aware of all the data being collected on the plant floor.
Thus, before spending time and money on yet another data collection tool, evaluate what you already have in place. You’ll likely find you have most of the correct tools already, you just need someone to help you organize your data and deliver the correct information to each stakeholder in the organization. A third-party such as Cybertrol Engineering can help connect the dots to define what data is needed, who needs to look at it, and what problems that data will solve.
Sometimes the end result of a data analysis consultation is a simple solution such as developing a new report that pulls together the identified KPIs to get the right data into the hands of the right people. Other times, we discover the data is there, it’s just being gathered manually, and the process needs to be digitized. No matter what the solution is, our goal is to help develop customers develop long-term methods for data reporting and analysis that will ultimately result in more uptime and increased productivity.
Recent Posts
- Recognizing Excellence: Tim Barthel's Leadership Honored by FPSA April 17, 2024
- Cybertrol Engineering: Bringing Sustainable Solutions to CheeseExpo April 4, 2024
- FactoryTalk Optix: An End-to-end HMI Solution from Rockwell Automation March 20, 2024
- Embracing Challenges and Customer Focus: Cybertrol's Winning Formula March 12, 2024
